Climate change in the Netherlands
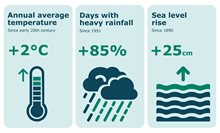
In a changing climate, the intensity and frequency of climate-related disasters is increasing, which leads to higher climate risk in the absence of adaptation actions. The Netherlands has seen a simultaneous increase in average and extreme temperatures, along with more frequent extreme rainfall and an increase of dry periods. The Royal Netherlands Meteorological Institute (KNMI) studies show that in recent decades, sea level rise along the Dutch coast has increased. In addition to gradual increases in temperature, precipitation, and regional drought, many weather records have been broken in recent decades. All KNMI climate scenarios (PDF) expect these changes to continue throughout this century.
Dutch climate scenarios
Climate scenarios provide the frameworks within which climate change can occur. Because future emissions of greenhouse gases are unpredictable, the United Nation’s Intergovernmental Panel on Climate Change (IPCC) has developed a range of scenarios for greenhouse gas concentrations. These scenarios outline various possible futures, based on potential emission levels and factors such as land use change, which are captured in Shared Socioeconomic Pathways (SSPs).
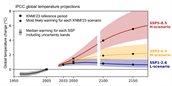
In 2023, KNMI published new climate scenarios (PDF) for the Netherlands, based on IPCC scenarios and climate models. KNMI used three different emission scenarios for this:
- High emissions scenario based on SSP5-8.5 (denoted by capital ‘H’): Projects a 4.9 °C increase in global temperatures by 2100.
- Moderate emissions scenario based on SSP2-4.5 (denoted by capital ‘M’): Projects a 2.8 °C increase in global temperatures by 2100.
- Low emissions scenario based on SSP1-2.6 (denoted by capital 'L'): Projects a 1.7 °C increase in global temperatures by 2100, in line with the Paris Agreement.
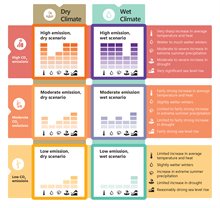
Further temperature increases will result in drier summers and wetter winters for the Netherlands. However, climate models project varying extents of these trends. To illustrate these, KNMI presents two variants for each emission scenario:
- 'Wet' scenario (denoted by the letter 'n', for 'nat' in Dutch): Winter rainfall increases significantly and summers become slightly drier.
- 'Dry' scenario (indicated by the letter 'd'): Winters become slightly more humid and summers become significantly drier.
By combining the three emission scenarios (H, M, and L) with the two variants 'wet' (n) and 'dry' (d), six climate scenarios emerge: Hn, Hd, Mn, Md, Ln and Ld. Please note that in Dutch, the term for ‘wet’ is ‘nat’, which is why the KNMI report uses the letters Hn, Mn, and Ln. Together, these six scenarios describe the framework within which climate change in the Netherlands is likely to occur.
- Hn: Strong increase in temperatures and an increase in annual rainfall. Much wetter winters and severe increase in extreme summer precipitation, moderate increase in drought and very significant sea level rise.
- Hd: Strong increase in temperatures and a decrease in annual rainfall. Wetter winters and moderate increase in extreme summer precipitation, severe increase in drought and very significant sea level rise.
- Mn: Moderate increase in temperatures and an increase in annual rainfall. Slightly wetter winters and strong increase in extreme summer precipitation, limited increase in drought and strong sea level rise.
- Md: Moderate increase in temperatures and a decrease in annual rainfall. Slightly wetter winters and limited increase in extreme summer precipitation, strong increase in drought and sea level rise.
- Ln: Slight increase in temperatures and an increase in annual rainfall. Slightly wetter winters, increase in extreme summer precipitation, limited increase in drought and reasonable sea level rise.
- Ld: Slight increase in temperatures and a decrease in annual rainfall. Slightly wetter winters, increase in extreme summer precipitation, limited increase in drought and reasonable sea level rise.
Note that the moderate scenarios (Mn and Md) are not always communicated to simplify the interpretation of the scenarios. Therefore, many datasets are often only available for the low and high scenarios. The older KNMI’14 scenarios only used the moderate and high scenarios and thus are not always aligned with the KNMI ’23 scenarios.
Delta Scenarios
The Delta Scenarios (2024) build on the KNMI climate scenarios, by adding social and economic trends, such as land use, energy demand and population growth. The socio-economic scenarios are periodically developed by the Netherlands Environmental Assessment Agency (PBL) and are called the 'Foresight study on Welfare and Human Environment (PDF)' (in Dutch: Welvaart en Leefomgeving). Together, they offer a more complete picture of what the Netherlands might look like in 2050 and 2100. These scenarios are plausible storylines that can be used to help policymakers to prepare for a range of possible futures, depending on how the climate changes and how society develops.
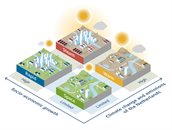
There are four Delta Scenarios for the Netherlands:
- Space: This is a future with relatively mild climate change and limited socio-economic growth. It allows more room for nature and water, with gradual sustainable development.
- Warm: In this scenario, the climate warms substantially and there is modest socio-economic growth. Nature and water systems face pressure from rising temperatures and extreme weather.
- Rapid: A future scenario with modest climate change, but fast socio-economic growth. Quick urban expansion creates high demand for land and water.
- Steam: In this scenario both climate change and socio-economic developments speed up. This leads to challenges for land and water resources.