Trends & projections for heat wave
Measurements by the Royal Netherlands Meteorological Institute (KNMI) show that temperatures in the Netherlands are steadily increasing (see changing temperature). In spring and summer, the temperature further increases due to stronger solar radiation caused by reduced cloud cover and declining air pollution. Temperature on the hottest days has increased more than the average temperature. The annual warmest day in De Bilt, is now on average 4 degrees warmer than in the year 1900.
Since 1901, the Netherlands has recorded 32 heat waves. Over a period of more than 100 years, half of all recorded heatwaves have occurred in the last 25 years.
Summer days, defined as days with 25°C or higher, occurred inland more than 40 days per year in the period 1991-2020, with the highest number in the southeast. Along the coast, there are usually 12 to 16 summer days. Around the Wadden Islands approximately 8 summer days per year occur.
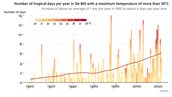
Tropical days, defined as days with 30 °C or higher, occur several times a year in the current climate (1991-2020). Along the coast, this averages around two days per year, while inland areas experience between 4 to 8 hot days a year. Extremely hot days, with temperatures reaching 35 °C or more, were rare around 1901, but are now becoming less rare. Only in the southeast they were observed close to 1 day per year in 1991-2020. In the summer of 2019, the temperature in the Netherlands exceeded 40 °C for the first time on record.
Future projections
In the coming decades, the number of tropical days increases in all KNMI'23 climate scenarios. Currently, De Bilt experiences about five such events per year (based on average of 1991–2020 data), but this number is projected to rise to between 8.5 and 35 by 2100, depending on future emissions. Tropical nights are currently rare, averaging just 0.3 per summer for De Bilt in 1991-2020. However, in high emission scenarios (PDF), this could increase to 3 around 2050 and up to 19 around 2100. In low emission scenarios, around one tropical night per summer is expected around 2050 and 2100. The increase in tropical days and nights will not be uniform across the country, with inland areas seeing more frequent and intense heat events than coastal regions, where sea breezes can provide some cooling. As a result of rising sea surface temperatures, nighttime cooling along coastal areas is significantly reduced under onshore wind conditions.
Also, both the number and intensity of hot days and heat waves are expected to rise. Under high emission scenarios, the average number of summer days per year in De Bilt is projected to increase (PDF) from 28 in the current climate (1991-2020) to 45-52 around 2050, and 84-93 around 2100. In low emission scenarios, this number is expected to reach 39-41 around 2050 and 2100. These numbers indicate average years. Individual years can be cooler or hotter due to the year-to-year variability.
It is important to note that all measurements and projections refer to non-urban monitoring locations. In cities, especially at night, temperatures tend to be higher and exceed the threshold values more frequently.