Trends & projections for drought
This section describes historical trends and future projections of drought in the Netherlands. Apart from changes in climate-related hazards, drought risk also depends on exposure and vulnerability. Please refer to the Risk assessment guidance page for more information.
As described in Dutch climate scenarios, the Royal Netherlands Meteorological Institute (KNMI) applies multiple scenarios. For the KNMI'23 climate change scenarios two driving variables are used: (1) Low and high greenhouse gas emissions, and (2) Changes in air circulation that may result in either wetter or drier scenarios. In the 'wet' scenario (denoted by the letter 'n'), winters will become much wetter and summers slightly drier. In the 'dry' scenario (indicated by the letter 'd'), winters will become slightly wetter and summers much drier. Combining these driving variables results in four climate scenarios.
Precipitation and evaporation fluctuate significantly per year, increasing the uncertainty of future projections. Over the past decades, April and May have become drier, particularly in inland regions. This trend can be attributed partly to rising temperatures associated with climate change and partly to increased sunshine resulting from reduced air pollution.
Extreme events
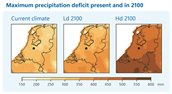
According to KNMI's climate scenarios, an extreme drought event in current conditions is expected to become an average drought event in 2100 for the worst-case scenario (high emissions and dry). Also, in all the climate scenarios, average potential net precipitation increases annually, but also the 5% extreme drought events increase.
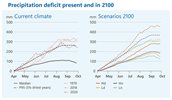
The Netherlands is in an area with decreasing summer precipitation, while higher temperatures increase potential evapotranspiration. Precipitation and evaporation are influenced by changes in large-scale circulation patterns. Westerly winds generally bring moist air, leading to more precipitation and milder temperatures. Easterly winds bring dry air, leading to higher potential evapotranspiration and relatively higher temperatures, especially in summer. In the dry scenarios it is expected that the precipitation deficit in the Netherlands will increase sharply, especially in the south.