Basic assessment of coastal and fluvial floods
The main aim of the basic assessment follows the question: are my assets located in an area susceptible to being flooded from coastal and fluvial waters? This assessment supports an initial analysis using basic, national-level hazard data to assess flood susceptibility. Two sets of flood maps are used: composite water depth maps and location-specific flood probability maps. The basic assessment follows three steps: (1) determining the maximum water depth, (2) determining location-specific flood probability, and (3) making a water risk profile.
For the basic assessment, in each of the three steps, there are three important elements to consider for the different data maps:
- The failure probabilities of primary flood defences are relatively high because of the underlying assumptions which result in a ‘conservative estimate’. To overcome this limitation, step 3 (the Water Risk Profile), offers an alternative method named BREACH.
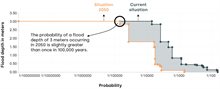
- The flood probability in 2050 is represented as the condition where all primary flood defences exactly meet the standards for flood defences set forth in the Dutch Water Act (see policies & regulations). These standards are expressed in terms of tolerable flood probability per dike section. For many locations in the Netherlands, this means that the probability of a flood occurring may decrease significantly compared to the current situation. These probabilities still show some level of overestimation, but less than the current condition maps.
- For more information regarding these data, we refer to the description in the Climate Impact Atlas.
- The failure definition refers to an initial failure mechanism, not the entire process resulting in an out-of-control breach and flooding.
- Hydraulic interdependencies are not taken into account. In reality a breach in a river levee leads to a lowering of the water level, which in turn leads to a lower failure probability of the levee on the opposite side of the river and downstream. Multiple breaches are not considered.
- Emergency measures are not considered. In reality water boards shall take measures to decrease the flood probability during high water situations.
The Expertise Network for Flood Protection (ENW)(PDF) also observed that the failure probability estimates resulting from the Statutory Assessment of primary flood defences were unrealistically high and made several recommendations to calculate more realistic values.
Step 1: Determining the maximum water depth
The first step of the basic assessment is to determine the maximum water depth for various asset locations. As highlighted in the definitions, four types of fluvial and coastal floods are relevant for The Netherlands. For each of the four types of floods distinguished by the European Floods Directive (EFR), free and open composite flood hazard maps are available online at the National Water and Flood Information System (LIWO). Please be aware of the assumptions underlying these maps and the limitations associated with their use. For example, the datasets depict potential floods that will not all occur simultaneously in reality and show the maximum water depth from the more than 5,000 available flood scenarios from LIWO (see Assumptions & limitations).

Main water system
- Type A: flooding of unprotected areas (floodplains, etc.) along the main water system.
- Type B: flooding of protected areas along the main water system due to the overtopping or failure of primary flood defences.
Regional water system
- Type C: flooding of protected areas along the regional water system due to the overtopping or failure of regional flood defences.
- Type D: flooding of unprotected areas from the regional water system.
Through the links above, flood hazard maps can be downloaded for these four types of floods. For each type, the following composite flood hazard maps are available for present day conditions:
- High probability of about 1/10 per year.
- Medium probability of about 1/100 per year.
- Low probability of about 1/1,000 per year.
- Very low probability of about 1/10,000 per year.
- Extremely low probability of about 1/100,000 per year or less.
Again, it should be noted that water depth is displayed as the maximum of different scenarios and shows the worst case-scenario. In addition, it shows an accumulation of flood scenarios that will not occur simultaneously.
LIWO currently does not include future climate projections for flood depths. The flood protection standards have a larger influence on future risk than climate conditions. Up until 2050, there are already regulations in place to increase many of the protection standards. Therefore, LIWO has a flood probability map for the 2050 level of protection standards. In the second step of the basic assessment, these flood probabilities are further assessed. Changes in flood depths from climate change effects is assumed to be very limited.
Step 2: Determining location-specific flood probability
The second step for the basic assessment includes the assessment of location-specific flood probability data available at LIWO. These data are available for the current probability of flooding (2022) and the flood probability in 2050. The data provides the expected flood probability where a water depth of more than 0, 20, 50 or 200 centimetres occurs, for any of the four flood types. They reflect the total probability of all possible floods regardless of the resulting flood depth.
With these maps, a conservative estimate can be made of the location-specific flood probability for present and future (2050) conditions.
Step 3: My Water Risk Profile
For some locations, more than one type of flooding might be present, or have different water levels for different probabilities of occurrence. These depths and probabilities can be combined in a water risk profile (a combination of step 1 and 2). The publicly available tool My Water Risk Profile can make a water risk profile for a single location.
A water risk profile describes the exceedance frequency of flood depth at any given location in the Netherlands due to extreme rainfall, high water, and dike breaches of regional and primary flood defences. Please note that the profile from My Water Risk Profile includes pluvial flood events.
The Water Risk Profile distinguishes itself from inundation maps or individual flood scenarios by considering all possible flood scenarios (in total, approximately 5,500 as of 2024, based on nationally available scenarios provided by water boards, provinces, and the national government) that can occur and their associated probabilities. For the primary flood defences in the current situation, it is based on current rainfall statistics, current failure probabilities of flood defences (version 2025.1.5, based on LIWO's data), and the assumption that all regional flood defences meet the standards. For the 2050 scenarios, the primary flood defences are supposed to meet their flood protection standard and climate change has been taken into account.
For the primary flood defences, two different methods can be used in the Water Risk Profile. These methods are based on the same underlying flood scenarios, but they combine them in different ways:
- Standard method: This method is based on the calculation of flood risks as used for setting the safety standards of primary flood defences. It considers each standard section individually and does not account for system interactions, interdependencies, residual strength, or the potential use of emergency measures. This method is used to derive the location-specific flood probability maps in LIWO.
- BREACH method: This method takes into account system interactions, interdependencies, residual strength, and emergency measures, through expert judgement and multiple breach scenarios. The method was developed for application within the financial sector.

The Water Risk Profile has been made publicly accessible at the request of the Dutch Ministry of Infrastructure and Water Management and Rijkswaterstaat, including the use of BREACH. For more information about this method, we refer directly to the My Water Risk Profile tool.
The detailed assessment aims to improve the estimation of flood probabilities by using a scenario-based approach.
