Trends & projections for ocean acidification
This section describes historical trends and future projections of ocean acidification in the North Sea. Apart from changes in climate-related hazards, the risk also depends on exposure and vulnerability. In relation to ocean acidification, it is recommended to also include other climate change driven impacts in the North Sea in risk assessments. Please refer to the Risk assessment guidance page for more information.
It is more difficult to determine trends in ocean acidification in shelf areas like the North Sea than in the open ocean. Research by NIOZ Royal Netherlands Institute for Sea Research (PDF) shows that ocean acidification in these regions is strongly influenced by terrestrial and riverine input, including nutrient runoff and added alkalinity. Seasonal variability in biological activity, particularly the production and decomposition of organic matter, introduce additional variability to acidification patterns. Nevertheless, measurements by NIOZ and Rijkswaterstaat bring insights into historical trends and future projections of ocean acidification in the North Sea.
How do we calculate ocean acidification?
Ocean acidification can be measured using different indicators:
- The pH scale shows how acidic seawater is. A lower pH means higher acidity.
- The saturation level is expressed using the saturation state, which indicates how soluble aragonite (a mineral used by marine organisms for shells and skeletons) is in the seawater.
- Total alkalinity, which reflects the ocean’s buffering capacity to neutralise acids. This indicator is used to understand a region’s resilience to acidification.
Historical trends
In the southern North Sea, the mean change of pH (PDF) amounted to approximately -0.0023 units per year between 2001 and 2011. This means that the southern North Sea has become slightly more acidic during this period. The measurements (PDF) also show that acidity levels show high seasonal variability. Moreover, this variability increases closer to the shores. More recent measurements (PDF) show that this downward trend in pH was followed by an upwards trend between in the past ten years. Although causes for this are unclear, researchers point that it may stem from cyclic patterns in the North Sea carbonate chemistry on decadal time scales, caused by changes in river discharge, sea currents, and biochemical processes.
Future projections
OSPAR projections for 2050 (PDF) show that ocean acidification will increase both under a low and high emission scenario. The models also show that acidity of water at the seafloor is changing at a faster rate compared to the surface waters. Generally, projections show that this change rate of acidity in bottom waters is about 10-15% steeper than surface waters.
- Low emission scenario: yearly average trend of surface pH in the North Sea is -0.0023 and -0.0027 in bottom waters. Both surface and bottom waters will also become slightly more undersaturated.
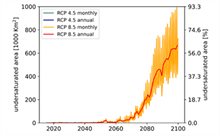
- High emission scenario: yearly average trend of surface pH in the North Sea is -0.0036 and -0.0040 in bottom waters. The North Sea is projected to become more undersaturated as well. Moreover, this using this scenario, ocean acidification is projected to accelerate towards the end of this century.
Trends beyond 2050 show large seasonal variability in ocean acidification throughout the entire North Sea and surrounding waters, including the Celtic Seas, Bay of Biscay, and Iberian Coast. This seasonal variability is even stronger in coastal areas, such as along the Dutch shores. Projections for 2060 and 2080 indicate significant expansion of undersaturated areas in bottom waters, both under a low and high emission scenario.