Risk assessment for storm
The risk assessment guidance for winter storm risk in the Netherlands consists of two parts:
- An introduction to winter storm risk including high-level monetized risk estimates on postcode 4 level.
- A Wind Risk Tool, to assess winter storm risk on an asset level using damage curves.
Winter storm risk assessments
For winter storms, the same approach is applied as other hazards, using the three main components of risk analysis: hazard, exposure, and vulnerability (see Risk assessment guidance).
For winter storms, the hazard represents the potential intensity for a windstorm to occur. The exposure refers to specific asset-level data on residential buildings. The vulnerability is the susceptibility of the exposed assets to damage. This vulnerability is separated into two major elements. First the loss ratio, which reflects the potential loss that a certain building may experience. Second the frequency ratio (PDF), which represents the likelihood of affected assets.
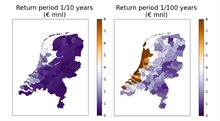
These three components are combined to estimate the expected damage from winter storms associated with specific return periods, namely 1-in-10-year and 1-in-100-year events (or a 1% and 0.1% annual probability of occurrence respectively). The figure below shows the expected damage for residential assets on a postcode 4 level for both return periods.
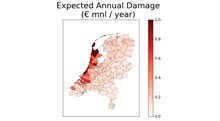
The next step in the risk assessment is to calculate the Expected Annual Damage (EAD). EAD represents long-term annual risk, or the average damage per year. These estimates are essential for understanding the long-term financial impacts of windstorms. The below figure gives the EAD for residential assets on a postcode 4 level.
Wind Risk Tool
For calculating potential or average annual loss a special tool is designed by the Vrije Universiteit Amsterdam: The Wind Risk Tool. You can download the tool from the menu on the right side of this page. This tool is designed to estimate risk (in euro/year) for individual assets making use of a simplified risk calculation requiring two datapoints in terms of windstorms. The user needs to provide the reconstruction value of the asset (or living area of house) and the gust speeds to which the asset is exposed to. The reconstruction value of the asset, next to the gust speeds, will determine the expected loss. If the objective is to determine the losses of an entire area, this can be done by providing an average reconstruction value and multiplying the loss by the number of assets. It is also possible by defining multiple assets in the area on different rows and summing up the average annual losses.
The tool makes use of a windstorm loss function to estimate loss ratios. For this, the loss function residential buildings in the Netherlands has been calibrated using reconstruction values and gust intensities (PDF). This function represents the damage a house can expect if it is hit by a windstorm. However, not every house gets damaged during a windstorm. Therefore, we also use a function to estimate the chance of a house getting damaged (PDF) during a windstorm of certain intensity. The tool then uses both functions and the reconstruction value to determine the potential damage to the asset for both intensities of storms (return periods 1-in-10 and 1-in-100 years) as provided by the user.
Two outputs are given:
- Potential loss (in euro) for an asset for storms with both return periods (only if an asset would be damaged).
- Average annual loss (in euro per year) which also includes the chance of an asset becoming damaged in a storm.