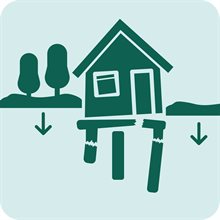
Risk assessment for subsidence
Several types of datasets related to subsidence are available. These datasets can be used to get a first indication of risk, but a better understanding of the risk requires more detailed and specialised local studies.
Subsidence affects a range of sectors in the Netherlands, but this risk assessment focuses on the built environment, as this is where the most detailed national-level datasets are available. The methodology is split into two parts:
- Existing buildings, focusing on foundation damage, including pile rot and differential settlement.
- New developments, focusing on current and future rates of subsidence. These datasets can also be relevant for other sectors affected by subsidence.
Existing buildings
Although no national-level databases currently exist with detailed information on the type and quality of individual building foundations, the potential (expected) foundation damage can be assessed using risk models based on assumptions. Please note that these datasets carry a high degree of uncertainty.
The pile rot risk and differential settlement risk datasets are recommended for:
- Identifying potential foundation problems.
- Prioritising locations for further assessment using local data.
- Providing a high-level indication of possible adaptation-options.
For both datasets: if the foundation type of an asset is known, the vulnerability layer indicates the expected potential damage. In addition, a high-risk score can have multiple causes, such as a high proportion of buildings on wooden piles or shallow foundations with low to average expected damage, or a low proportion of buildings on wooden piles or shallow foundations with high average damage. A combination of these factors can also produce a high score. It is therefore recommended that assets with a high-risk score be assessed further using local foundation assessments.
Following identification using high-level data, a more detailed building-level assessment is always necessary to confirm the foundation type and condition.
Pile rot risk
The Pile rot risk map indicates the potential risk to houses at the neighbourhood level. The data consist of two underlying maps:
- Percentage of buildings on wooden piles, based on expert indication.
- Vulnerability of buildings to pile rot by 2050, based on factors such as depth of the wooden foundation, the mean lowest groundwater level, the year of construction, and the soil type.
Groundwater levels can change because of climate change, which can in turn increase the risk of foundation damage. The following scenarios are simulated for the pile rot risk map: current conditions without changes in groundwater levels, and future conditions (2050) under moderate (SSP2-4.5) and high (SSP5-8.5) climate change scenarios.
Differential settlement
The Differential settlement risk map indicates the potential risk of differential settlement at neighbourhood scale. The data consist of two underlying maps:
- Percentage of buildings on shallow foundations, based on expert indication.
- Vulnerability of those buildings to differential settlement, depending on factors such as the rate of subsidence, the local susceptibility of the subsoil to settlement, and the susceptibility of the building itself to differential settlement.
Subsidence rates are accelerated by climate change, which in turn increases a location’s vulnerability to differential settlement. Two scenarios for the future (2050) are simulated: a moderate (SSP2-4.5) and high (SSP5-8.5) climate change scenario.
New developments
For new developments in the built environment, it is recommended to understand both recent land subsidence and predicted future subsidence.
Recent land subsidence
The dataset shows the average annual land movement (subsidence and uplift) between 2020 and 2024. Based on satellite data, it consists of three maps:
- Total land subsidence, which is the overall ground movement from the deep subsurface to the ground surface.
- Shallow land subsidence, which is the movement of the upper part of the subsurface.
- Elevation model, which is the height of the ground surface.
For new developments, this data can help build an understanding of recent conditions and where subsidence may cause problems, offering insights into the shallow and deep causes of land subsidence and uplift. Note that the dataset does not show movement of buildings; for a precise assessment it is recommended to combine these maps with local knowledge and additional data.
Future subsidence rates
Whereas the recent land subsidence maps are based on satellite observations, future land subsidence prognoses for peat and clay areas under certain groundwater level scenarios are derived from the Atlantis soil subsidence model. Two variations of these maps are available: future subsidence rates caused by groundwater lowering, gas extraction and salt extraction; and future soil subsidence rates caused by soil loading.
The dataset Future subsidence rates caused by groundwater lowering, gas extraction, and salt extraction is available for the periods 2020-2050 and 2020-2100. The extent of future land subsidence depends mainly on the on the water-level policy pursued and global rise in temperature. Both factors have been incorporated into a moderate emission scenario (SSP2-4.5), which keeps the water level fixed, and a high emission scenario (SSP5-8.5) which assumes water-level indexation. These maps provide an initial indication of the extent of land subsidence up to 2050 and 2100.
The Loading-related subsidence map provides insight into regional susceptibility to subsidence following soil loading. Soil loading is the process of raising land, which is required for the construction of new infrastructure and buildings in clay and peat areas. However, this process can compress the land, leading to subsidence. The map shows which locations are susceptible to subsidence, based on the hypothetical situation of every location in the Netherlands being raised by one metre of sand, allowing for proper comparison between areas. The dataset represents this hypothetical situation over a 30-year period (until 2050) and does not include climate scenarios.